Abstract
To understand the mechanism and potency of novel drugs or cell therapies it is vital to assess not only the degree but also the dynamics of the target cell response. in particular, in cytotoxicity assays it is important to assess the effects of novel drugs or cell therapies on cell viability, to know if the cells are dead or alive. Cytotoxicity is an important property to assess in all therapies as a treatment that kills too many cells may not be safe but one that doesn't kill enough of the right cells (e.g. cancer) may not be effective.
Endpoint assays provide only a snapshot in time of the cellular response and can miss key time points or features of the response. Here, we used the Maestro Z real-time, label-free impedance assay to examine the response of a non-small cell lung cancer cell line, A549, to chemotherapy compounds. A549 cells proliferated to confluency within 24 hours and the addition of Dox resulted in a decrease in impedance consistent with drug-mediated apoptosis of A549 cells.
Introduction to tracking cytotoxicity
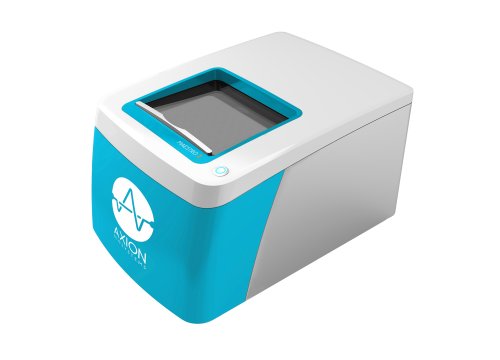
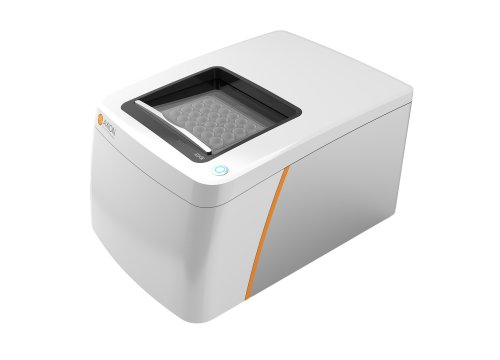
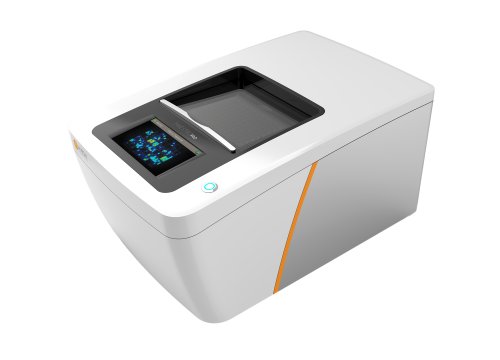
When testing a new drug or cell therapy, endpoint assays can identify whether the cells are dead or alive, but they cannot reveal the dynamics or mechanisms behind the cellular response. In addition, when comparing compounds or doses, a single time point may be insufficient to capture the maximum response for all treatments. With label-free, non-invasive, continuous monitoring, the Maestro Z impedance assay (Figure 1) captures the entire time course of the cytolysis, revealing not only the degree, but also the dynamics and rate of cell death. Often, the kinetics of the cell response give the most insight into the efficacy and mechanism of a compound.


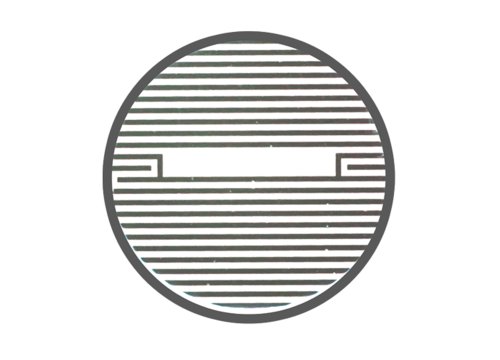
Impedance measures how much electrical signal (orange-colored arrows) is blocked by the electrode-cell interface (right). When the electrode is uncovered, electrical signal (represented by arrows) easily passes and the impedance is low. When cells cover the electrode, less electrical signal passes and the impedance is high. When cells die or detach, the impedance decreases back towards baseline.
A549 cells are human lung adenocarcinoma alveolar epithelial cells that are commonly used as a model of non-small cell lung cancer for drug development and testing (Ren et al 2016). A549 cells have been used to examine the efficacy of many commonly used chemotherapy compounds, such as paclitaxel (Liebmann et al 1993; Shen et al 1994; Sun et al 2011). To examine the use of impedance for quantifying the dynamics of cell growth and death, A549 cells were continuously monitored using the Maestro Z platform during growth and in response to a common chemotherapy drug known to induce apoptosis.
Materials and Methods
Materials
Cells and reagent
A549 (Cat. CCL-185) cells were obtained from ATCC (Manassas, VA). Media was composed of F12-k base media (Gibco, Cat. 21127022), 10% FBS (Gibco, Cat. 16000044), and 1% penicillin/streptomycin (Gibco, Cat. 15140122).
CytoView-Z 96 plate
A CytoView-Z 96-well plate (Axion BioSystems) was used for these experiments (Figure 2). The plate is composed of a polyethylene terephthalate (PET) surface with a gold recording electrode embedded in the culture surface of each well. Humidity reservoirs on the plate were filled with sterile deionized water to maintain humidity.
Maestro Z impedance-based assay platform
The Maestro Z platform (Axion BioSystems) uses impedance measurements (ohms, Ω) to quantify the presence of cells on the electrode. To measure impedance, small electrical signals are delivered to the electrodes. Cell attachment, spreading, and cell-cell connections block these electrical signals and are detected as an increase in impedance. Impedance is also sensitive to subtle changes in cell conformation, such as those caused by receptor-mediated signaling or cell morphology. Since impedance is non-invasive and label-free, impedance assays can be used to quantify dynamic cellular responses over minutes, hours, and days. In addition, the Maestro Z platform has built-in environmental control, finely controlling temperature and CO2 throughout the experiment.
Methods
CytoView Z-plate preparation
CytoView Z-plates were coated with 100 µL of fibronectin solution (1µg/mL) per well. Surface-coated impedance plates were incubated at 37°C and 5% CO2 for at least 1 hour. After incubation, excess surface coating was aspirated from each well. Then, 100 µL of complete medium was added per well and docked on the Maestro Z platform to record a media reference.

Figure 2: Image of A549 cells at 100% confluency on a CytoView-Z 96 plate. The viewing window in each plate permits visualization of cells. Black horizontal bars are the recording and ground electrodes. Scale bar is 200 µm.
Cell culture
A549 cells were thawed and cultured according to the supplier recommendations, passaging as needed. Cells were lifted from flasks and dissociated via trypsinization (Gibco, Cat. 15400054). Cell density and viability was determined using a hemocytometer. The cell suspension was transferred to a 15 mL conical tube and centrifuged at 1,000 RPM for 5 minutes. The supernatant was aspirated, being careful to not disturb the cell pellet. A549 cells were resuspended and diluted in media to a working concentration of 350,000 cells/ml (Figure 2).
Results of cytotoxicity and cell viability assay
A549 cell proliferation
Cell viability (as a measure of impedance) of A549 cells was tracked continuously using the Maestro Z system. A549 cells adhered to the bottom of the wells and proliferated to cover the bottom of the well, resulting in a steady increase in impedance. By 24 hours, cells reached 100% confluency and impedance plateaued (Figure 3A).


(A, B) After application of Dox, the impedance measurements revealed the dynamic response of the A549 cells. (C) Using on-plate controls for cell growth (No Treatment Control) and cell death (Tergazyme), the percent cytolysis was tracked in real time throughout the time course of the response.
Real-time tracking of A549 cytolysis
Once the cells reached confluency, cells were dosed with Dox, an anthracycline chemotherapy drug, or DMSO (0.1%) as a vehicle control (Vehicle). For on-plate controls, some wells were left untreated (No Treatment), while some wells were treated with Tergazyme, an enzyme-active detergent, (i.e. full lysis control). Returning relative impedance to zero ohms reflects full cytolysis. At the highest dose, Dox caused a slow decrease in impedance (Figure 3A-B).
Dynamics of cytolysis
While the degree of cell death is important and often measured by endpoint assays, the kinetics of cell death are vital for understanding mechanisms and quantifying efficacy. Here in Figure 3C, percent cytolysis was tracked in real-time after dosing, with Tergazyme (orange) representing 100% or full cytolysis and No Treatment (light gray) representing 0%. After 20 hours, the higher dose of Dox showed an increase in percent cytolysis, reaching 50% cytolysis (Kill Time 50) at 31 hours post-dose. As expected, vehicle control wells continued to show little change in percent cytolysis compared to the no treatment control.
Conclusion
The Maestro Z impedance assay captured the dynamics of cell growth and death in real-time. Percent cytolysis and endpoints, such as Kill Time 50, provide insight into the kinetics and efficacy of chemotherapy compounds, such as Dox. The Maestro Z platform provides a complete, simple, real-time, label-free method for monitoring cell proliferation and the dynamics of chemically mediated cytolysis.


